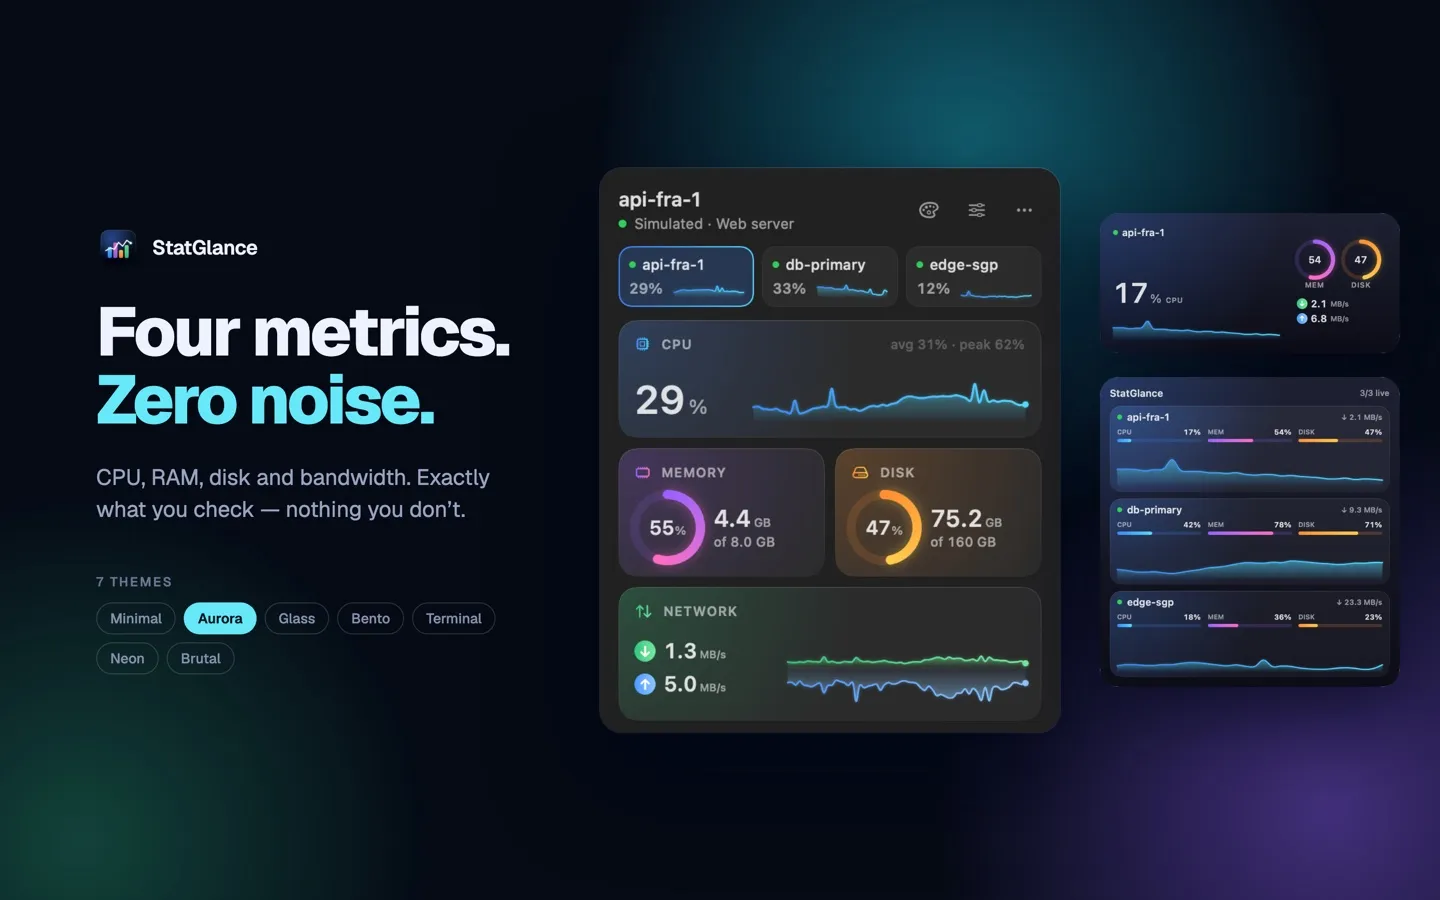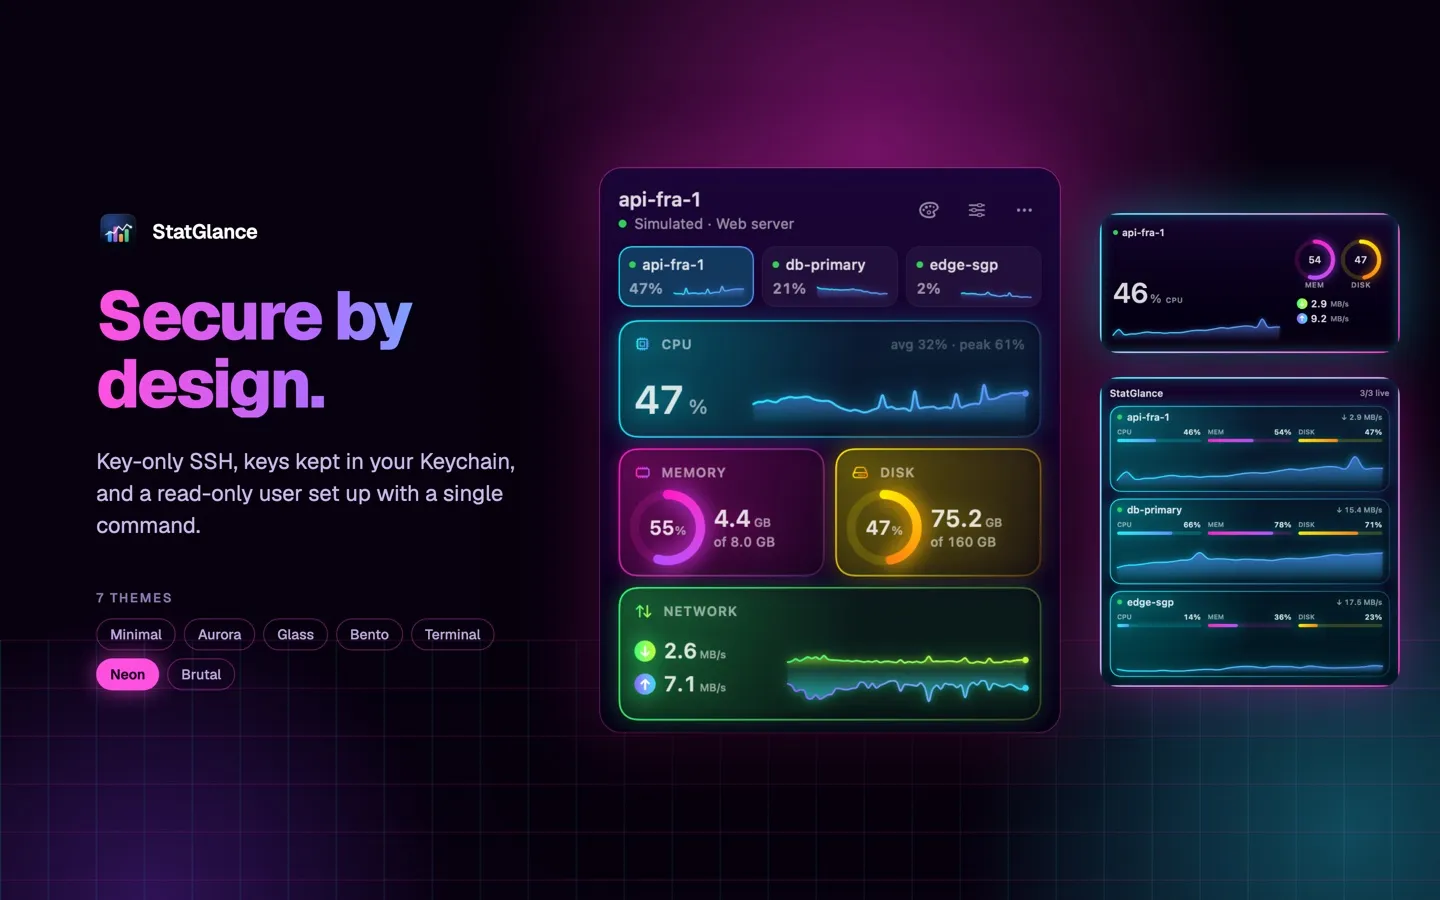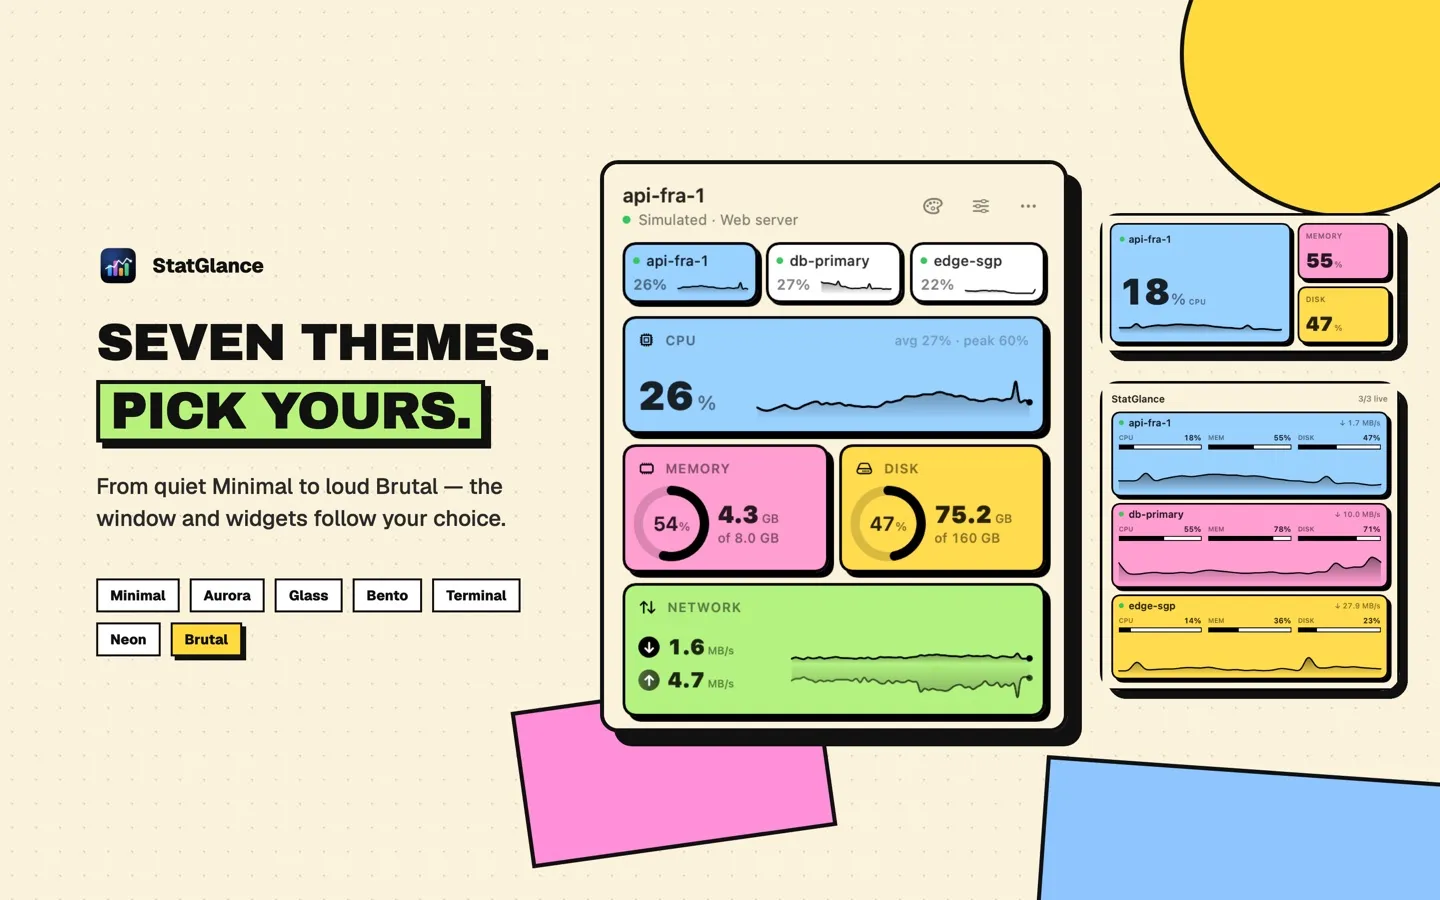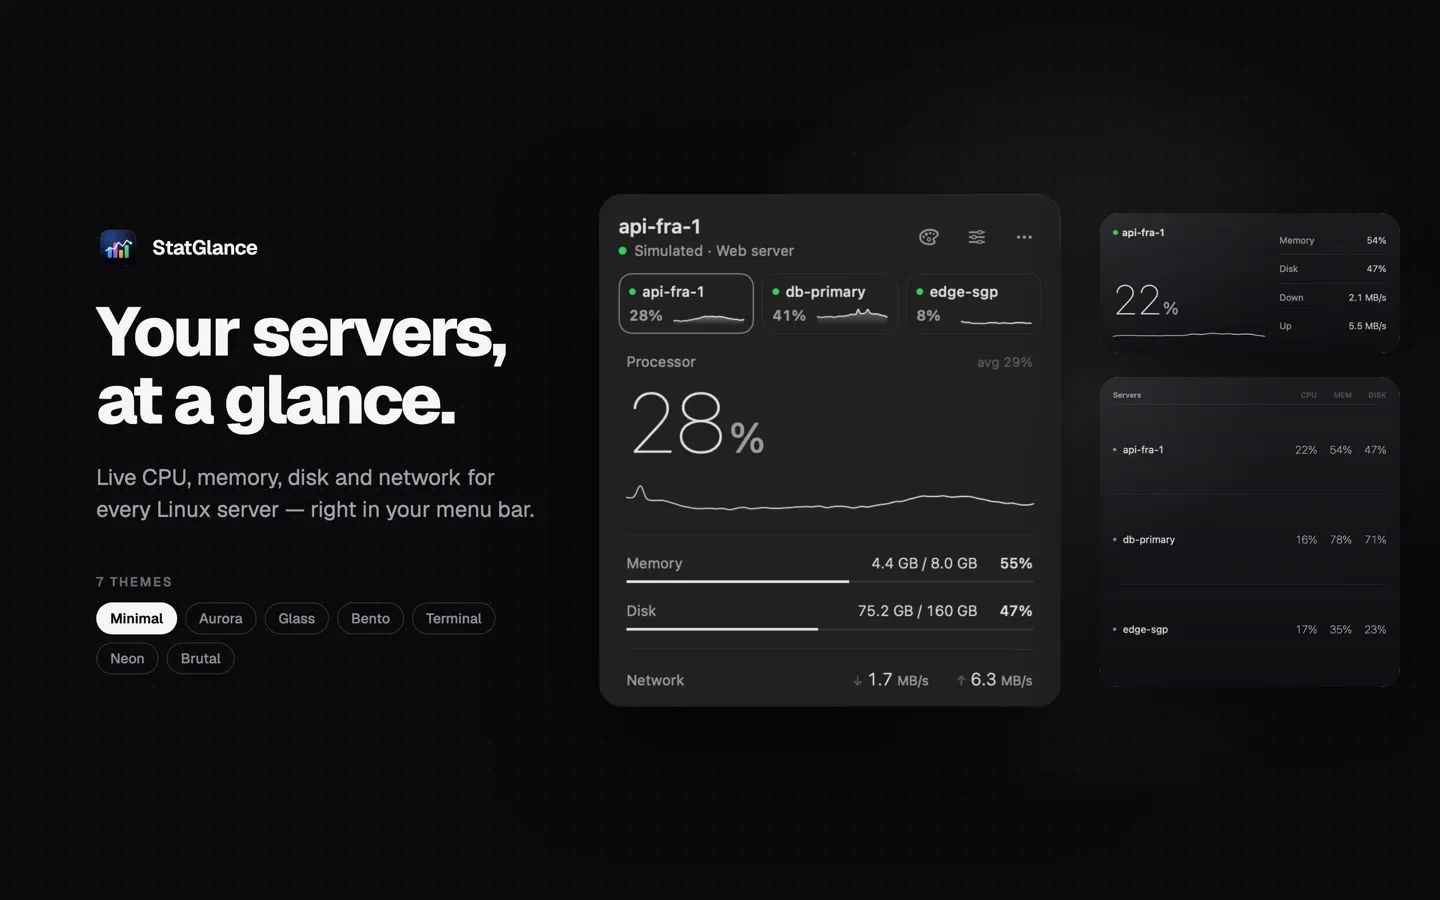
Four metrics. Zero noise.
Tools like Grafana are powerful, but when you just want a quick look at your VPS, they are more than you need. StatGlance stays deliberately small: CPU, RAM, disk and bandwidth, nothing else.
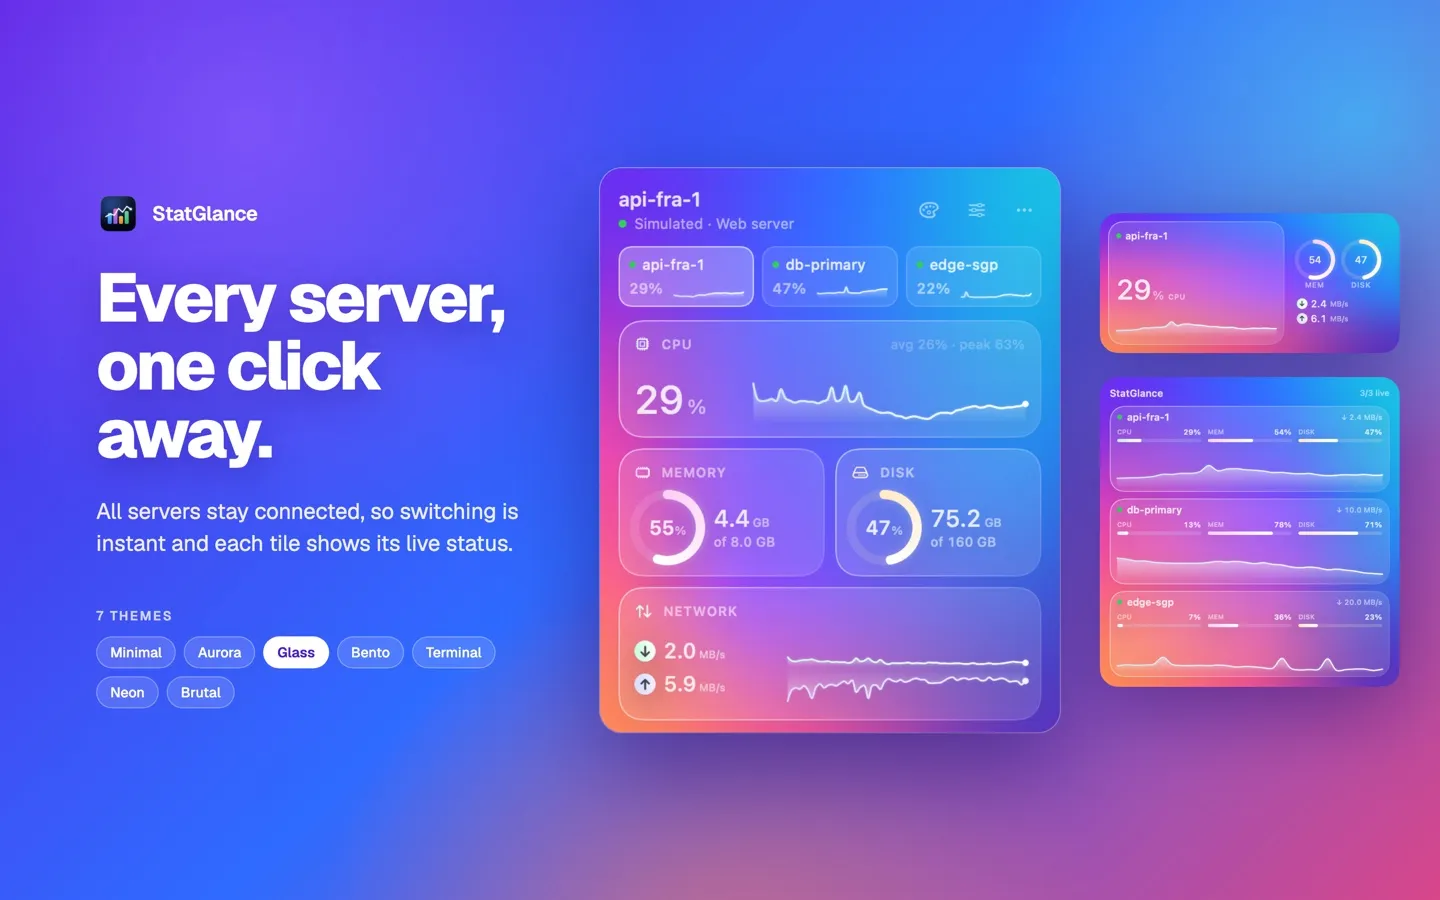
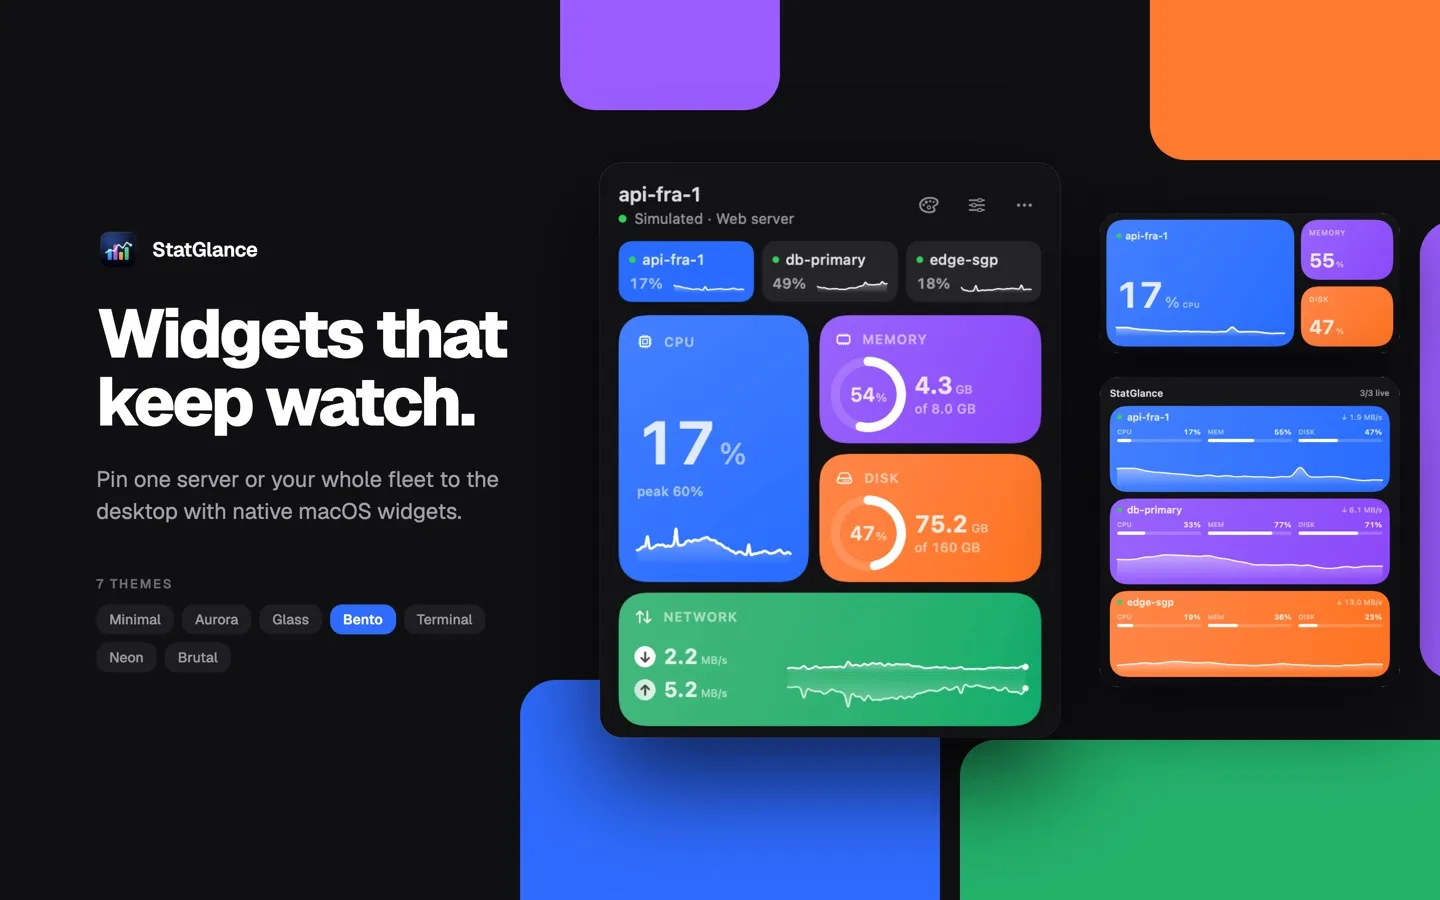
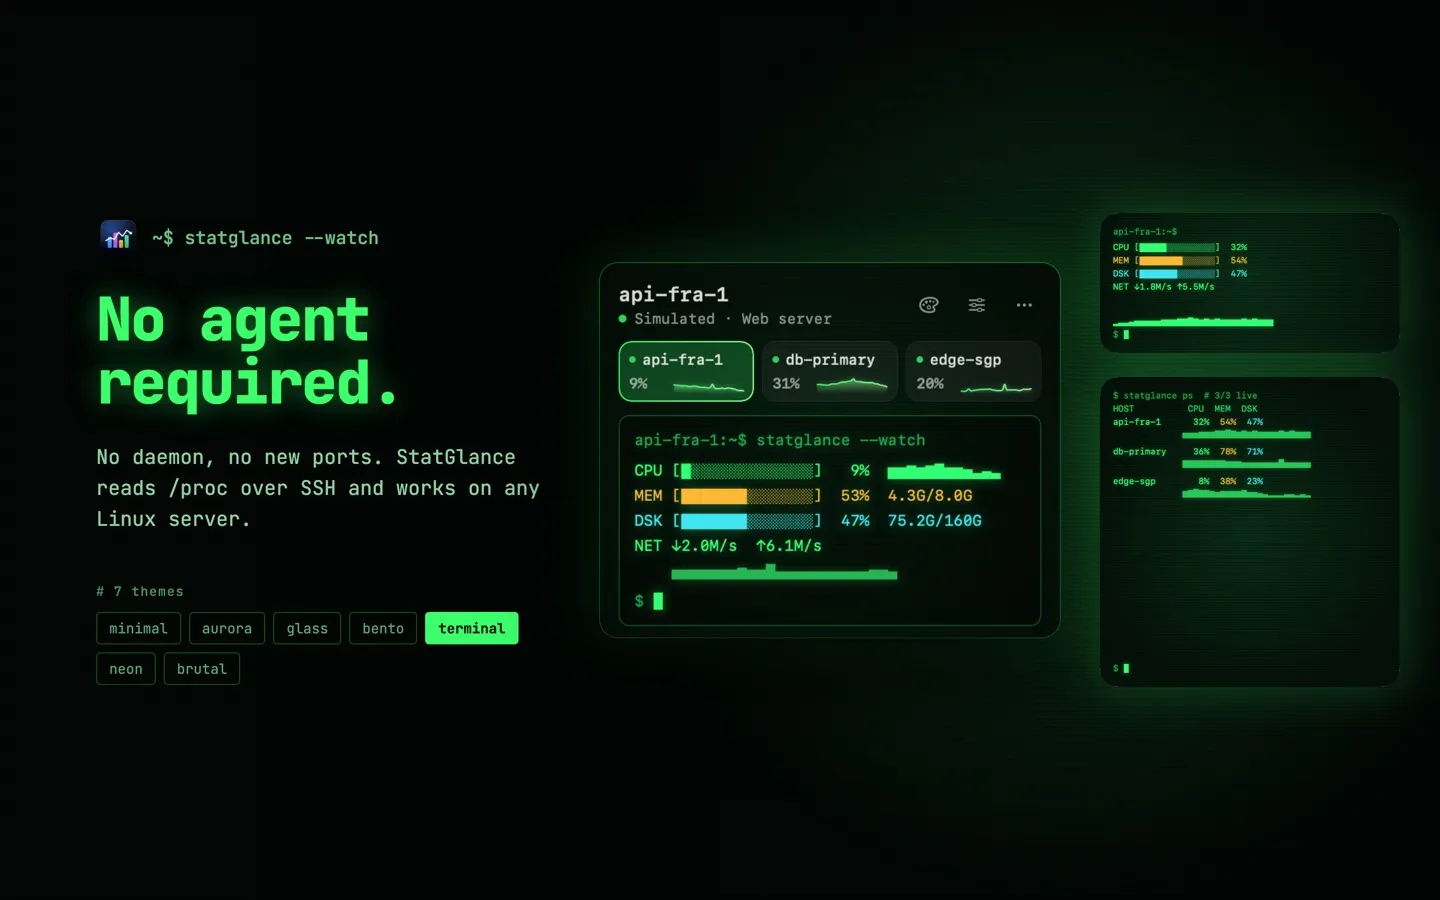
- CPU usage with a live sparkline in the menu bar
- Memory usage and disk fullness
- Real-time download and upload speed
- Values above 90% are highlighted in every theme